Source: https://www.investopedia.com/terms/m/movingaverage.asp
Loading the player...
What is a 'Moving Average - MA'
A moving average (MA) is a widely used indicator in technical analysis that helps smooth out price action by filtering out the “noise” from random price fluctuations. It is a trend-following, or lagging, indicator because it is based on past prices.
The two basic and commonly used moving averages are the simple moving average (SMA), which is the simple average of a security over a defined number of time periods, and the exponential moving average (EMA), which gives greater weight to more recent prices. The most common applications of moving averages are to identify the trend direction and to determine support and resistance levels. While moving averages are useful enough on their own, they also form the basis for other technical indicators such as the Moving Average Convergence Divergence (MACD).
Next Up
BREAKING DOWN 'Moving Average - MA'
A moving average (MA) is calculated in different ways depending on its type.
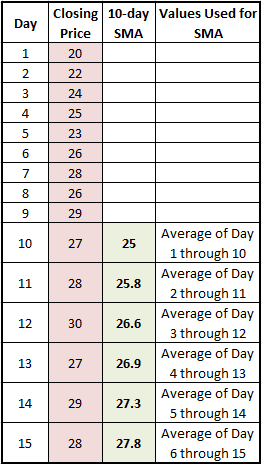
Let's look at a simple moving average (SMA) of a security with the following closing prices over 15 days:
Week 1 (5 days) – 20, 22, 24, 25, 23
Week 2 (5 days) – 26, 28, 26, 29, 27
Week 3 (5 days) – 28, 30, 27, 29, 28
A 10-day moving average would average out the closing prices for the first 10 days as the first data point. The next data point would drop the earliest price, add the price on day 11 and take the average, and so on as shown below.

How to Use Moving Averages
Moving averages lag current price action because they are based on past prices; the longer the time period for the moving average, the greater the lag. Thus, a 200-day MA will have a much greater degree of lag than a 20-day MA because it contains prices for the past 200 days. The length of the moving average to use depends on the trading objectives, with shorter moving averages used for short-term trading and longer-term moving averages more suited for long-term investors. The 50-day and 200-day MAs are widely followed by investors and traders, with breaks above and below this moving average considered to be important trading signals.
[ Moving averages are just one technical indicator that traders use to identify profitable trade opportunities. If you're interested in learning about more, check out Investopedia's Technical Analysis Course, where we cover both basic and advanced technical analysis, chart reading skills, and the technical indicators you need to succeed. The course includes over five hours of on-demand video, exercises, and interactive content built by an experienced market technician. ]
Moving averages also impart important trading signals on their own, or when two averages cross over. A rising moving average indicates that the security is in an uptrend, while a declining moving average indicates that it is in a downtrend. Similarly, upward momentum is confirmed with a bullish crossover, which occurs when a short-term moving average crosses above a longer-term moving average. Downward momentum is confirmed with a bearish crossover, which occurs when a short-term moving average crosses below a longer-term moving average.
RELATED TERMS
RELATED ARTICLES
Read more: Moving Average (MA) https://www.investopedia.com/terms/m/movingaverage.asp#ixzz5C9EOW9lk
Follow us: Investopedia on Facebook
 SHARE
SHARE

No comments:
Post a Comment