SOURCE: https://www.investopedia.com/articles/technical/04/072104.asp
A Glance At An Equilibrium Chart
 SHARE
SHARE

The names of mathematicians and statisticians dominate the list of technical analysis innovators; it's not often we see newspaper writers on this list, but Tokyo newspaper writer Goichi Hosoda is an exception to the rule. In the years before World War II, Hosoda--with the help of several assistants--developed the Ichimoku Kinko Hyo, or "equilibrium-chart-at-a-glance technique." Released in 1968, the technique was designed to illustrate where prices were likely to go and when to trade. In this article, we look at this extraordinary technique and how you can apply it to enhance your trading.
Constructing an Ichimoku Chart
First, let's take a look at an Ichimoku chart so we have a visual point of reference. The Ichimoku chart consists of three lines, which are color-coded on the chart below, and a "cloud":
First, let's take a look at an Ichimoku chart so we have a visual point of reference. The Ichimoku chart consists of three lines, which are color-coded on the chart below, and a "cloud":
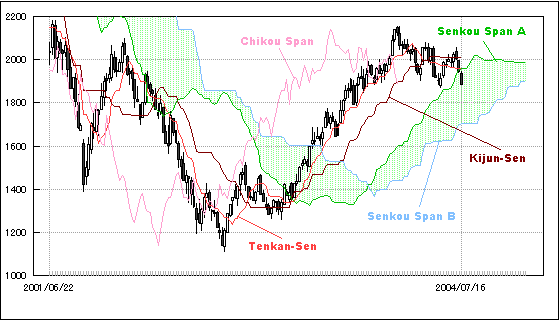 |
| Figure 1: EUR/USD Ichimoku Chart. Provided by ForexWatcher.com. |
Let's see what these lines represent, and how they are plotted:
- Tenkan-Sen, or conversion line (red) - (Highest high + lowest low) / 2, calculated over the past seven to eight time periods.
- Kijun-Sen, or base line (maroon) - (Highest high + lowest low) / 2, calculated over the past 22 time periods.
- Chikou Span, or lagging span (pink)- The most current closing price plotted 22 time periods behind (optional).
- Senkou Span A (green)- (Tenkan-Sen + Kijun-Sen) / 2, plotted 26 time periods ahead.
- Senkou Span B - (blue) (Highest high + lowest low) / 2, calculated over the past 44 time periods. Plot 22 periods ahead.
The "cloud," known as the Kumo, is the space between Senkou Span A and Senkou Span B. The time period is most often measured in days; however, this can be modified to be any time unit as long as it is consistent throughout all calculations. We should note that, due to the shortened trading week (which used to be six days long), the time period values shown here are revised versions of the ones that Hosoda used in 1968.
To calculate these figures manually, you can use a spreadsheet program like Excel (with formulas to speed up the process), and then plot the points on a time series chart. There are also several commercial charting programs that have this technique installed by default and can automatically show the Ichimoku chart in real time.
Interpreting the Chart
Now that we have a chaotic chart filled with colorful lines and strange clouds, we need to know how to interpret it. The Ichimoku chart can be used to determine a variety of things. Here is a list of signals and how you can spot them:
Now that we have a chaotic chart filled with colorful lines and strange clouds, we need to know how to interpret it. The Ichimoku chart can be used to determine a variety of things. Here is a list of signals and how you can spot them:
- Strong Signals - A strong buy signal occurs when the Tenkan-Sen crosses above the Kijun-Sen from below. A strong sell signal occurs when the opposite occurs. The signals must be above the Kumo.
- Normal Signals - A normal buy signal occurs when the Tenkan-Sen crosses above the Kijun-Sen from below. A normal sell signal occurs when the opposite occurs. The signals must be within the Kumo.
- Weak Signals - A weak buy signal occurs when the Tenkan-Sen crosses above the Kijun-Sen from below. A weak sell signal occurs when the opposite occurs. The signals must be below the Kumo.
- Overall Strength - Strength is shown to be with the sellers if the Chikou Span is below the current price. Strength is shown to be with the buyers when the opposite is true.
- Support/Resistance Levels - Support and resistance levels are represented by the presence of the Kumo. If the price is entering the Kumo from below, then the price is at a resistance level. If the price is falling into the Kumo, then there is a support level.
- Trends - Trends can be determined by simply looking at where the current price is in relation to the Kumo. If the price stays below the Kumo, then there is a downward trend (bearish). Alternatively, if the price stays above the Kumo, then there is an upward trend (bullish).
The Ichimoku charts give us a rare opportunity to predict market timing, support/resistance levels, and even false breakouts, all in one easy-to-use technique.
Why Isn't Everyone Making Money?
Although it was created back in 1968, this charting technique did not gain international attention until the 1990s. It has since been applied by traders worldwide. Despite its success, the Ichimoku chart still has some drawbacks.
Although it was created back in 1968, this charting technique did not gain international attention until the 1990s. It has since been applied by traders worldwide. Despite its success, the Ichimoku chart still has some drawbacks.
- Empirical Decision Making – As with most technical analysis, empirical decision making is required when determining the time period to use. Keep in mind that the time periods are the only thing making this technique different from a moving averageanalysis, so it is critical to fine-tune (optimize).
- 24-Hour Markets – Markets which operate 24 hours a day, like the currency market, are without an actual set open and close price. To get around the problem, traders often make the calculations in real-time or use the open and close times that are closely associated with the currency pair being traded. For example, for the EUR/USD, it would be wise to use the New York open and close since that is when the majority of trading occurs.
- Occasional Short Time Between Trades – There will be times when the buy and sell signals occur within close proximity. In a world without commissions or bid/ask spreads, this would not be a problem; however, quick trades like this can cause commissions to eat into your profits.
Conclusion
When Goichi Hosoda developed the Ichimoku Kinko Hyo charting technique, he was definitely onto something. The technique gives traders an easy way to determine buy and sell signals, support and resistance levels, trends, and signal strength. However, the charting method is not without its drawbacks, such as its need for empirical decision making and time period definitions, and its indications to make high frequency trades. Despite these flaws, the technique is employed often by the international trading community, and can prove to be an asset to any trader.
When Goichi Hosoda developed the Ichimoku Kinko Hyo charting technique, he was definitely onto something. The technique gives traders an easy way to determine buy and sell signals, support and resistance levels, trends, and signal strength. However, the charting method is not without its drawbacks, such as its need for empirical decision making and time period definitions, and its indications to make high frequency trades. Despite these flaws, the technique is employed often by the international trading community, and can prove to be an asset to any trader.
RELATED ARTICLES
Read more: A Glance At An Equilibrium Chart https://www.investopedia.com/articles/technical/04/072104.asp#ixzz5BsK1mYNL
Follow us: Investopedia on Facebook
No comments:
Post a Comment